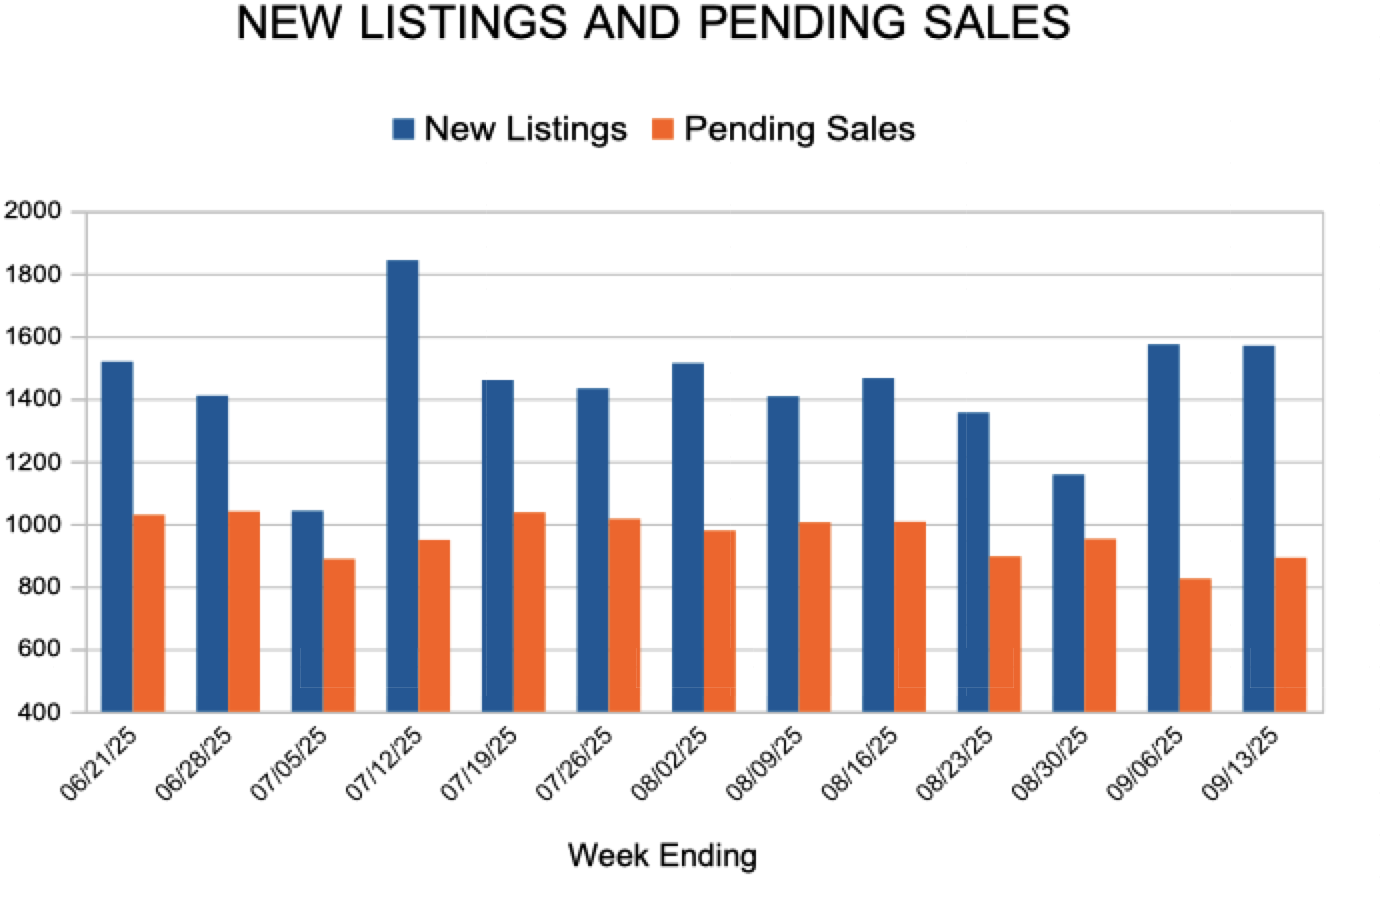
New Listings and Pending Sales
Twin Cities Real Estate
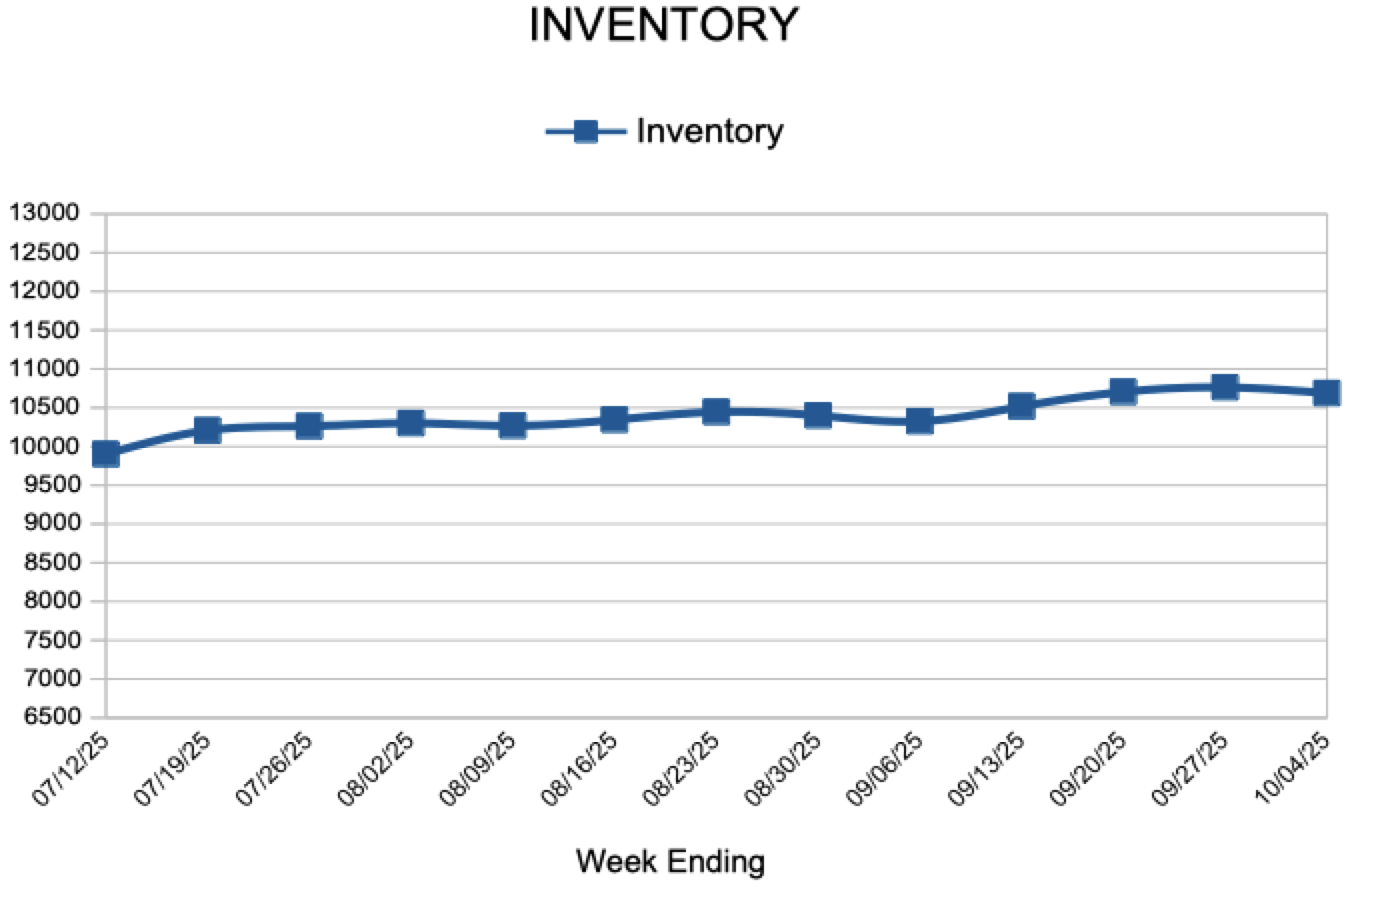
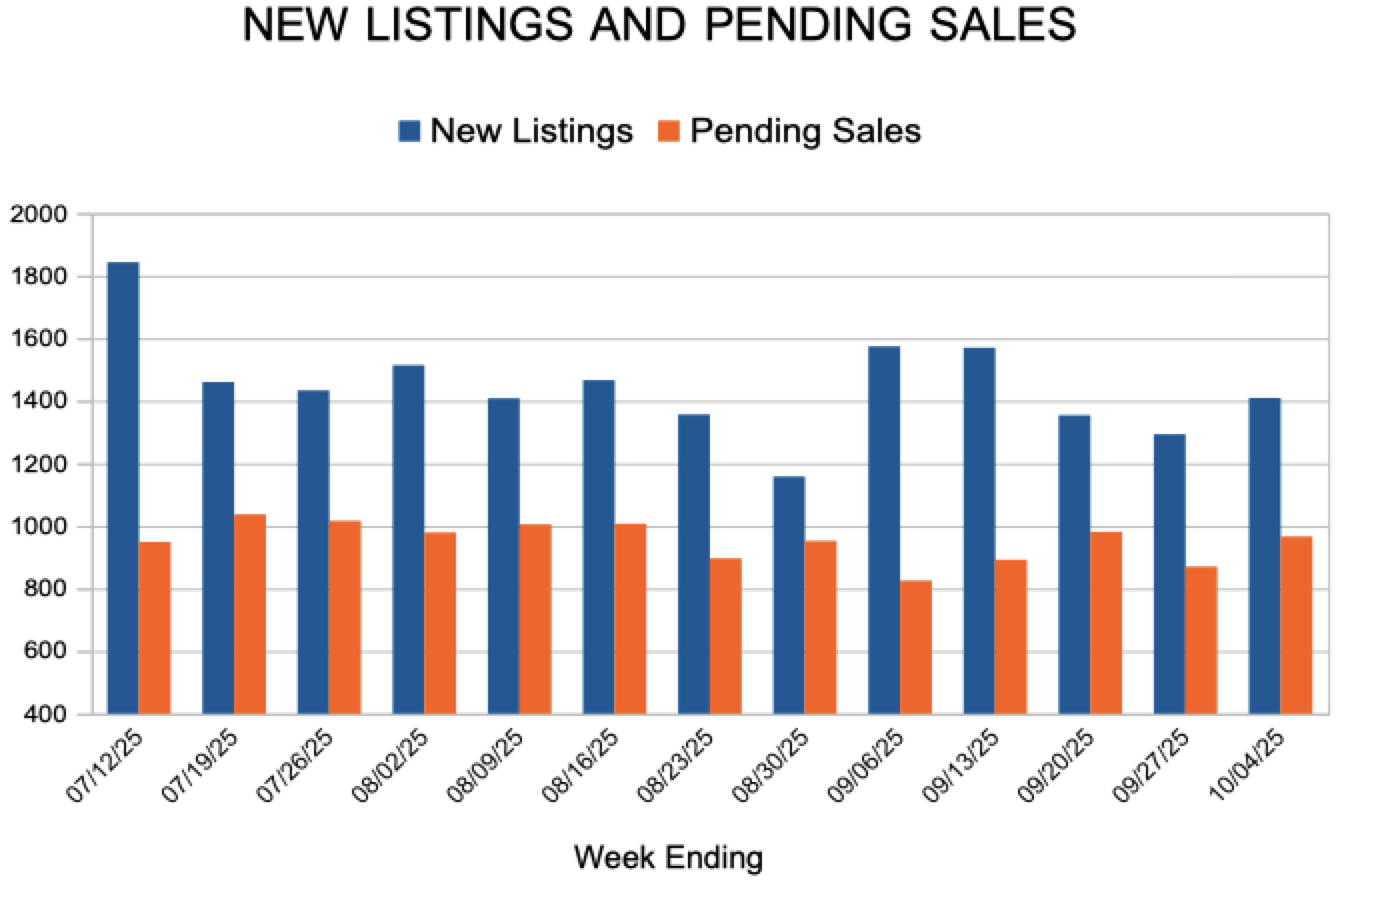
 For Week Ending October 4, 2025
Nationally, the best time to buy a home is the week of October 12–18, according to a recent report from Realtor®.com. Historically, this week offers the most favorable conditions for buyers, with higher inventory levels, lower home prices, reduced competition, and a slower market pace. However, the optimal buying window varies across local markets. Some areas have already experienced peak buyer conditions, while others may not reach their ideal period until November or December.
IN THE TWIN CITIES REGION, FOR THE WEEK ENDING OCTOBER 4:
FOR THE MONTH OF AUGUST:
All comparisons are to 2024
Click here for the full Weekly Market Activity Report. From MAAR Market Data News.
October 9, 2025
Mortgage rates decreased this week. Over the last few weeks, mortgage rates have settled in at their lowest level in about a year. There is growing evidence that homebuyers are digesting these lower rates and gradually are willing to move forward with buying a home, which is boosting purchase activity.
Information provided by Freddie Mac.
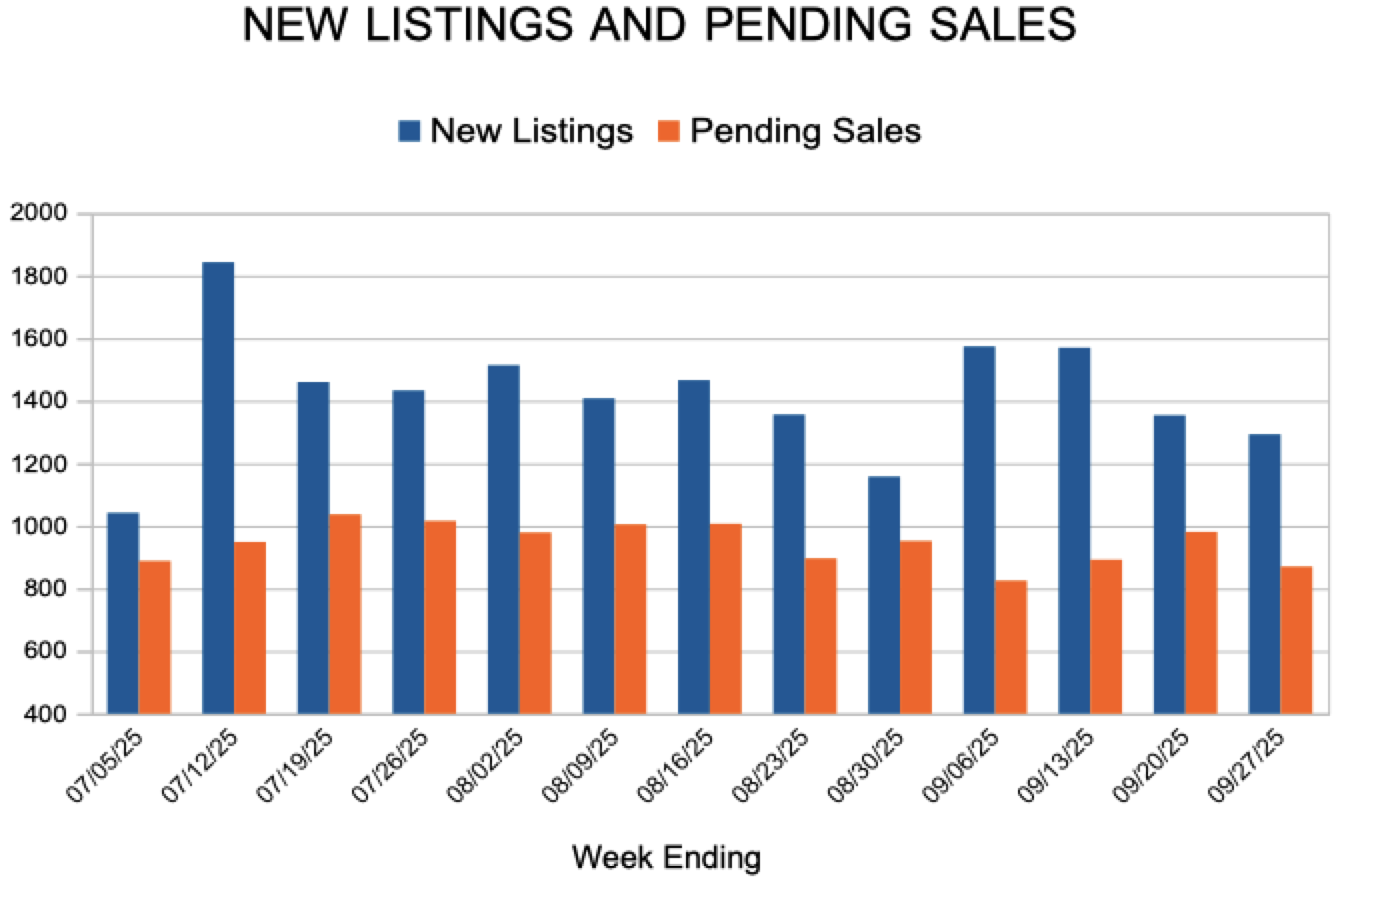
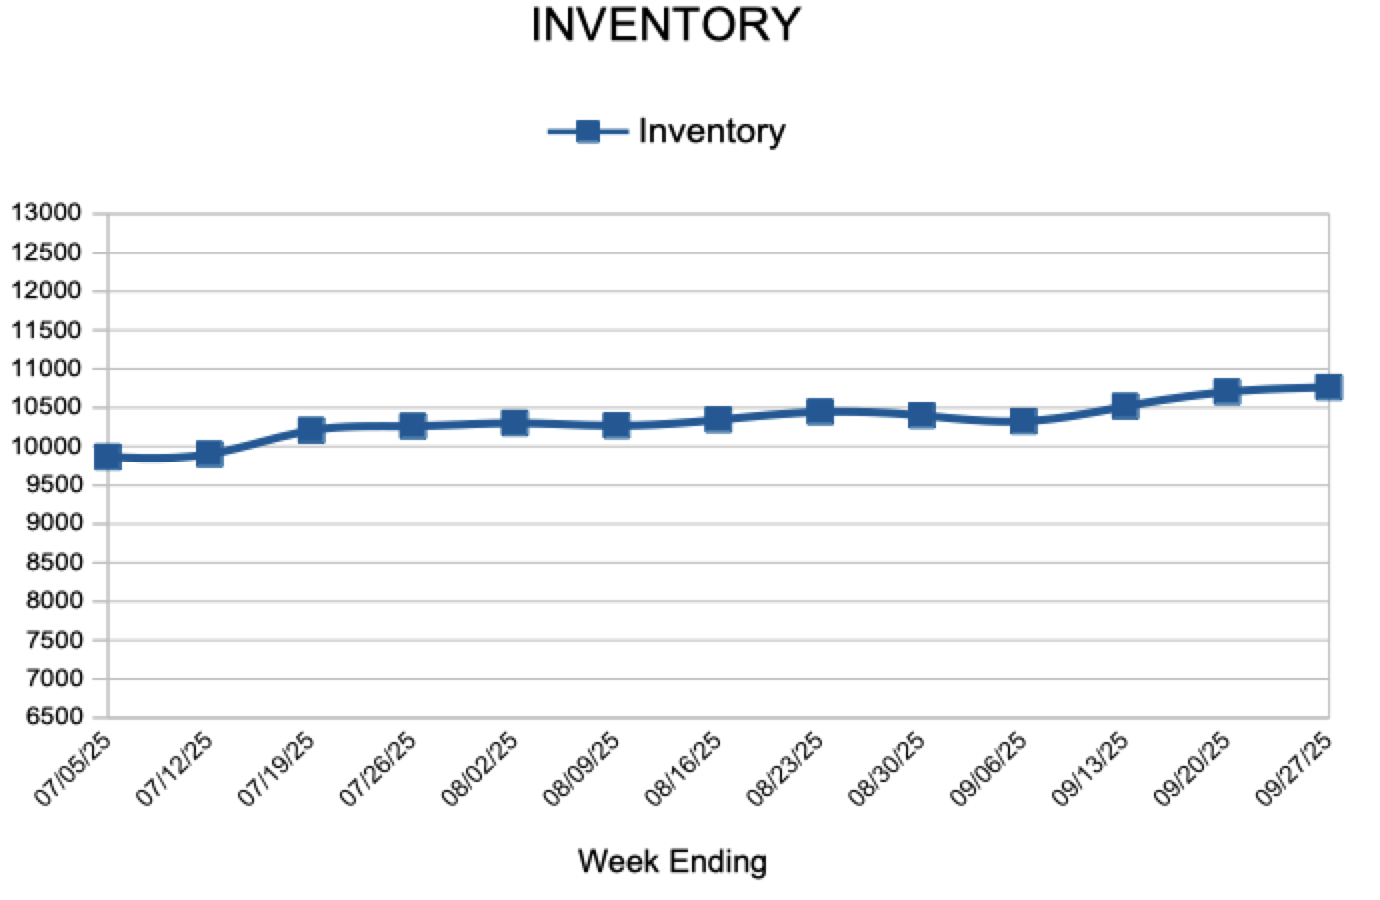 For Week Ending September 27, 2025
According to ATTOM’s Q2 2025 Home Equity and Underwater Report, 47.4% of mortgaged residential properties in the U.S. were considered equity-rich—defined as having at least 50% equity—in the second quarter of 2025. This marks an improvement from the first quarter, when 46.2% of mortgaged homes met that threshold, ending a trend of three consecutive quarterly declines.
IN THE TWIN CITIES REGION, FOR THE WEEK ENDING SEPTEMBER 27:
FOR THE MONTH OF AUGUST:
All comparisons are to 2024
Click here for the full Weekly Market Activity Report. From MAAR Market Data News.
 For Week Ending September 13, 2025
In a rare shift for the U.S. housing market, new homes have become more affordable than existing homes. According to the U.S. Census Bureau, the median sales price of a new home was $403,800 in July, compared to $422,400 for an existing home. New-home prices have declined year-over-year for eight consecutive quarters, while existing-home prices have continued to rise.
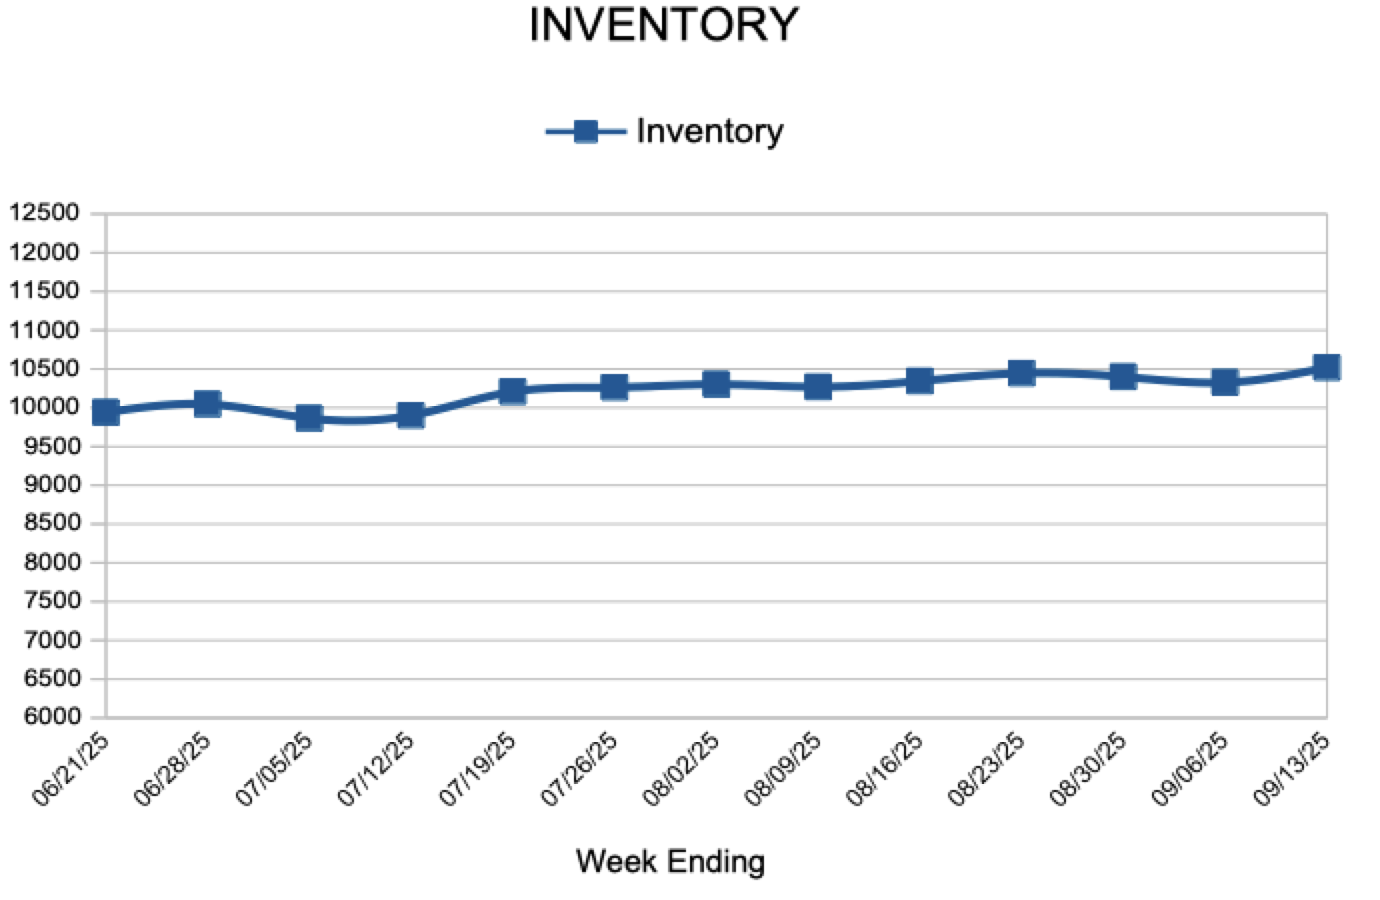
IN THE TWIN CITIES REGION, FOR THE WEEK ENDING SEPTEMBER 13:
FOR THE MONTH OF AUGUST:
All comparisons are to 2024
Click here for the full Weekly Market Activity Report. From MAAR Market Data News.

1549 Livingston Avenue
Suite 109
West St Paul, MN 55118
651-455-8858