Inventory
Weekly Market Report
 For Week Ending April 9, 2022
Rising mortgage interest rates are taking a toll on borrowers, having increased more than 1.5 points since the beginning of the year, the fastest three-month rate increase since 1994, according to Freddie Mac. The recent surge in mortgage rates has caused a decline in mortgage demand, with the Mortgage Bankers Association (MBA) reporting the Refinance Index is down 62% compared to a year ago, while the unadjusted Purchase Index is 6% lower compared to this time last year.
IN THE TWIN CITIES REGION, FOR THE WEEK ENDING APRIL 9:
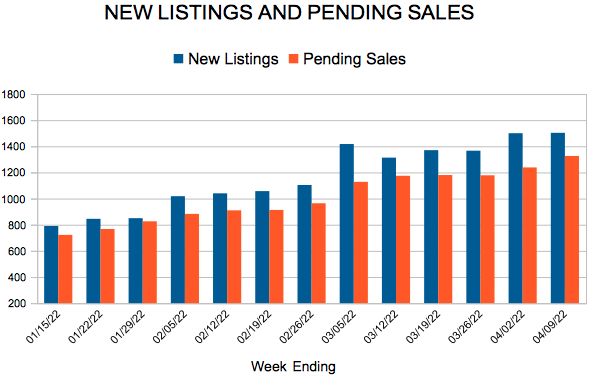
- New Listings decreased 13.8% to 1,503
- Pending Sales increased 3.3% to 1,326
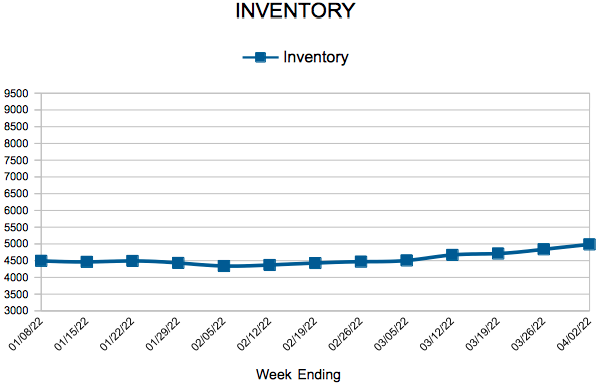
- Inventory decreased 12.1% to 4,990
FOR THE MONTH OF MARCH:
- Median Sales Price increased 7.8% to $353,950
- Days on Market decreased 10.3% to 35
- Percent of Original List Price Received increased 0.8% to 102.7%
- Months Supply of Homes For Sale remained flat at 1.0
All comparisons are to 2021
Click here for the full Weekly Market Activity Report. From MAAR Market Data News.
Limited inventory pushes median price over $350,000 as spring market heats up
- Supply is down during the worst inventory shortage in decades
- Median Sales Price reaches a record $353,000
- Median days on market is up marginally compared to the frenzy of 2021
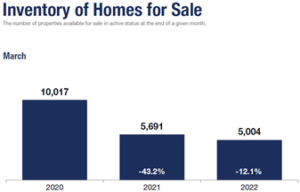
(April 15, 2022) – According to new data from Minneapolis Area REALTORS® and the Saint Paul Area Association of REALTORS®, the Twin Cities metro area set a new record median sales price of $353,000, a 7.5 percent increase from March 2021. Even though that’s the first time the metro-wide median price exceeded $350,000, the rate of increase is 30.0 percent less than it was a year ago. The ongoing inventory shortage is mostly to blame, although the 12.0 percent decline in housing inventory this March was far less than the 43.0 percent decline last March.
LISTINGS & SALES
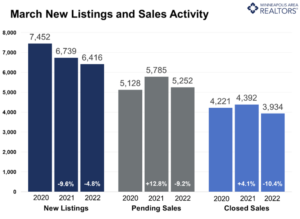
Last month sellers listed 6,416 homes on the market, 4.8 percent fewer than March 2021, but 4.2 percent greater than 2019. Some aging empty nesters are staying put and aging in place while others have chosen to remodel or expand their current home instead of listing it. Many homeowners are “married” to their interest rates and are reluctant to give up their monthly payments given rising rates. Buyers signed 9.2 percent fewer purchase agreements than March of last year and closed on 10.4 percent fewer homes. The declines partly reflect the unique strength of the 2021 market but also possibly a reaction to increased mortgage rates.
The monthly payment on a $350,000 home with 10.0% down increases by $187 per month when rates move from 4.0 to 5.0 percent. “Some buyers are trying to get ahead of further rate increases,” said Denise Mazone, President of Minneapolis Area REALTORS®. “But the truth is that equity gains over time are likely to outpace the slightly higher payments.” Listings spent 10.3 percent fewer days on market than last March on average, after a 36.1 percent decline the year prior. But the median days on market showed a year-over-year increase for only the third time since September 2019. This could be a sign of a more balanced market. Yet sellers accepted offers 2.7 percent higher than their list price, on average.
HOME PRICES & INVENTORY
Home price are expected to continue rising given a chronically undersupplied market with strong demand, but perhaps at a lesser rate. The median price rose 7.5 percent to $353,000; the average price rose 7.0 percent to $409,754—both record highs. On average, buyers are spending about $200 per square foot. The Twin Cities presently has about four week’s supply of inventory (0.9 months), while a balanced market has roughly four to six months’ supply. But over a decade of underbuilding has meant steep competition for most listings. That coincides with a huge Millennial generation aging into prime homeownership years, not to mention the desire for more space for working and learning from home. Even though inventory levels were down, there are signs that supply is beginning to stabilize. “While inventory levels remain low, there are listings that come on market and go under contract quickly that don’t always show up in the month-end inventory count,” according to Mark Mason, President of the Saint Paul Area Association of REALTORS®.
LOCATION & PROPERTY TYPE
Market activity varies by area, price point and property type. New home sales rose 1.4 percent compared to a 10.5 percent dip for previously owned homes. Single family sales fell 9.3 percent while condo sales were down 5.3 percent. Sales in Minneapolis declined 8.8 percent while Saint Paul sales were down 18.2 percent. Hastings, Hugo and Lino Lakes saw the greatest increase in closed sales while Prior Lake, Richfield and Minnetonka saw sales fall by 35.0 percent or more.
MARCH 2022 BY THE NUMBERS (COMPARED TO A YEAR AGO)
- Sellers listed 6,416 properties on the market, a 4.8 percent decrease from last March
- Buyers signed 5,252 purchase agreements, down 9.2 percent (3,934 closed sales, down 10.4 percent)
- Inventory levels fell 12.1 percent to 5,004 units
- Month’s Supply of Inventory was down 10.0 percent to 0.9 months (4-6 months is balanced)
- The Median Sales Price rose 7.5 percent to $353,000
- Days on Market fell 10.3 percent to 35 days, on average (median of 12 days, up 9.1 percent from March 2021)
- Changes in Sales activity varied by market segment
- Single family sales decreased 9.3 percent; Condo sales fell 5.3 percent & townhouse sales declined 10.3 percent
- Traditional sales were down 9.2 percent; foreclosure sales fell 6.9 percent; short sales were up 28.6 percent (from 7 to 9)
- Previously owned sales dropped 10.5 percent; new construction sales rose 1.4 percent
MARCH 2022 HOUSING CHARTS
From The Skinny Blog.
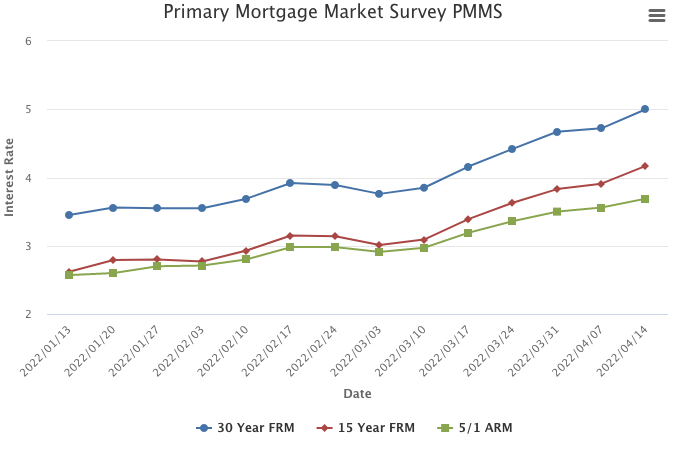
Mortgage Rates Hit Five Percent
April 14, 2022
This week, mortgage rates averaged five percent for the first time in over a decade. As Americans contend with historically high inflation, the combination of rising mortgage rates, elevated home prices and tight inventory are making the pursuit of homeownership the most expensive in a generation.
Information provided by Freddie Mac.
New Listings and Pending Sales
Inventory
Weekly Market Report
 For Week Ending April 2, 2022
The median national home price recently hit a new all-time high of $405,000 in March, a 13.5% increase annually, according to Realtor.com’s latest Monthly Housing Trends Report. As home prices continue to rise, the share of homes experiencing price reductions has also grown, with 25 of the 50 largest metro areas reporting an increase in price reductions last month, up from 18 in February, which may be an early sign the housing market is moderating somewhat.
IN THE TWIN CITIES REGION, FOR THE WEEK ENDING APRIL 2:
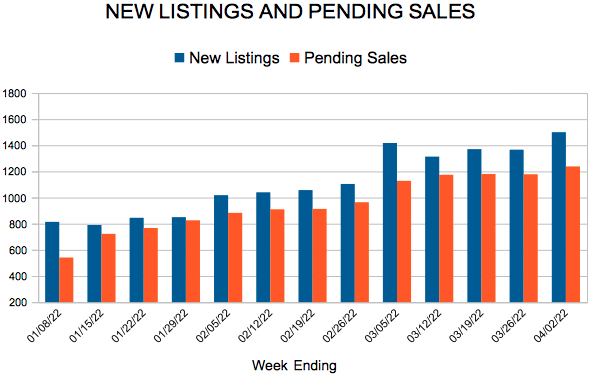
- New Listings increased 0.2% to 1,500
- Pending Sales decreased 11.4% to 1,238
- Inventory decreased 11.8% to 4,986
FOR THE MONTH OF FEBRUARY:
- Median Sales Price increased 8.3% to $340,000
- Days on Market decreased 4.3% to 44
- Percent of Original List Price Received increased 0.7% to 100.8%
- Months Supply of Homes For Sale decreased 10.0% to 0.9
All comparisons are to 2021
Click here for the full Weekly Market Activity Report. From MAAR Market Data News.
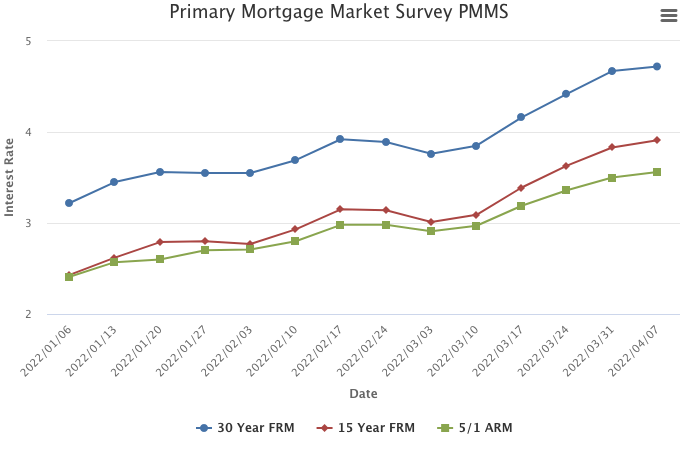
Mortgage Rates Continue Climbing
April 7, 2022
Mortgage rates have increased 1.5 percentage points over the last three months alone, the fastest three-month rise since May of 1994. The increase in mortgage rates has softened purchase activity such that the monthly payment for those looking to buy a home has risen by at least 20 percent from a year ago.
Information provided by Freddie Mac.
New Listings and Pending Sales
- « Previous Page
- 1
- …
- 83
- 84
- 85
- 86
- 87
- …
- 106
- Next Page »
